

CASE STUDY · LANDSLIDE MONITORING
Satellite landslide monitoring in mountain areas with L-band InSAR
Three landslide areas in a mountain environment, covered by dense forest, analysed with L-band InSAR from the SAOCOM constellation: measurement points and displacement time series even where X-band could not reach.
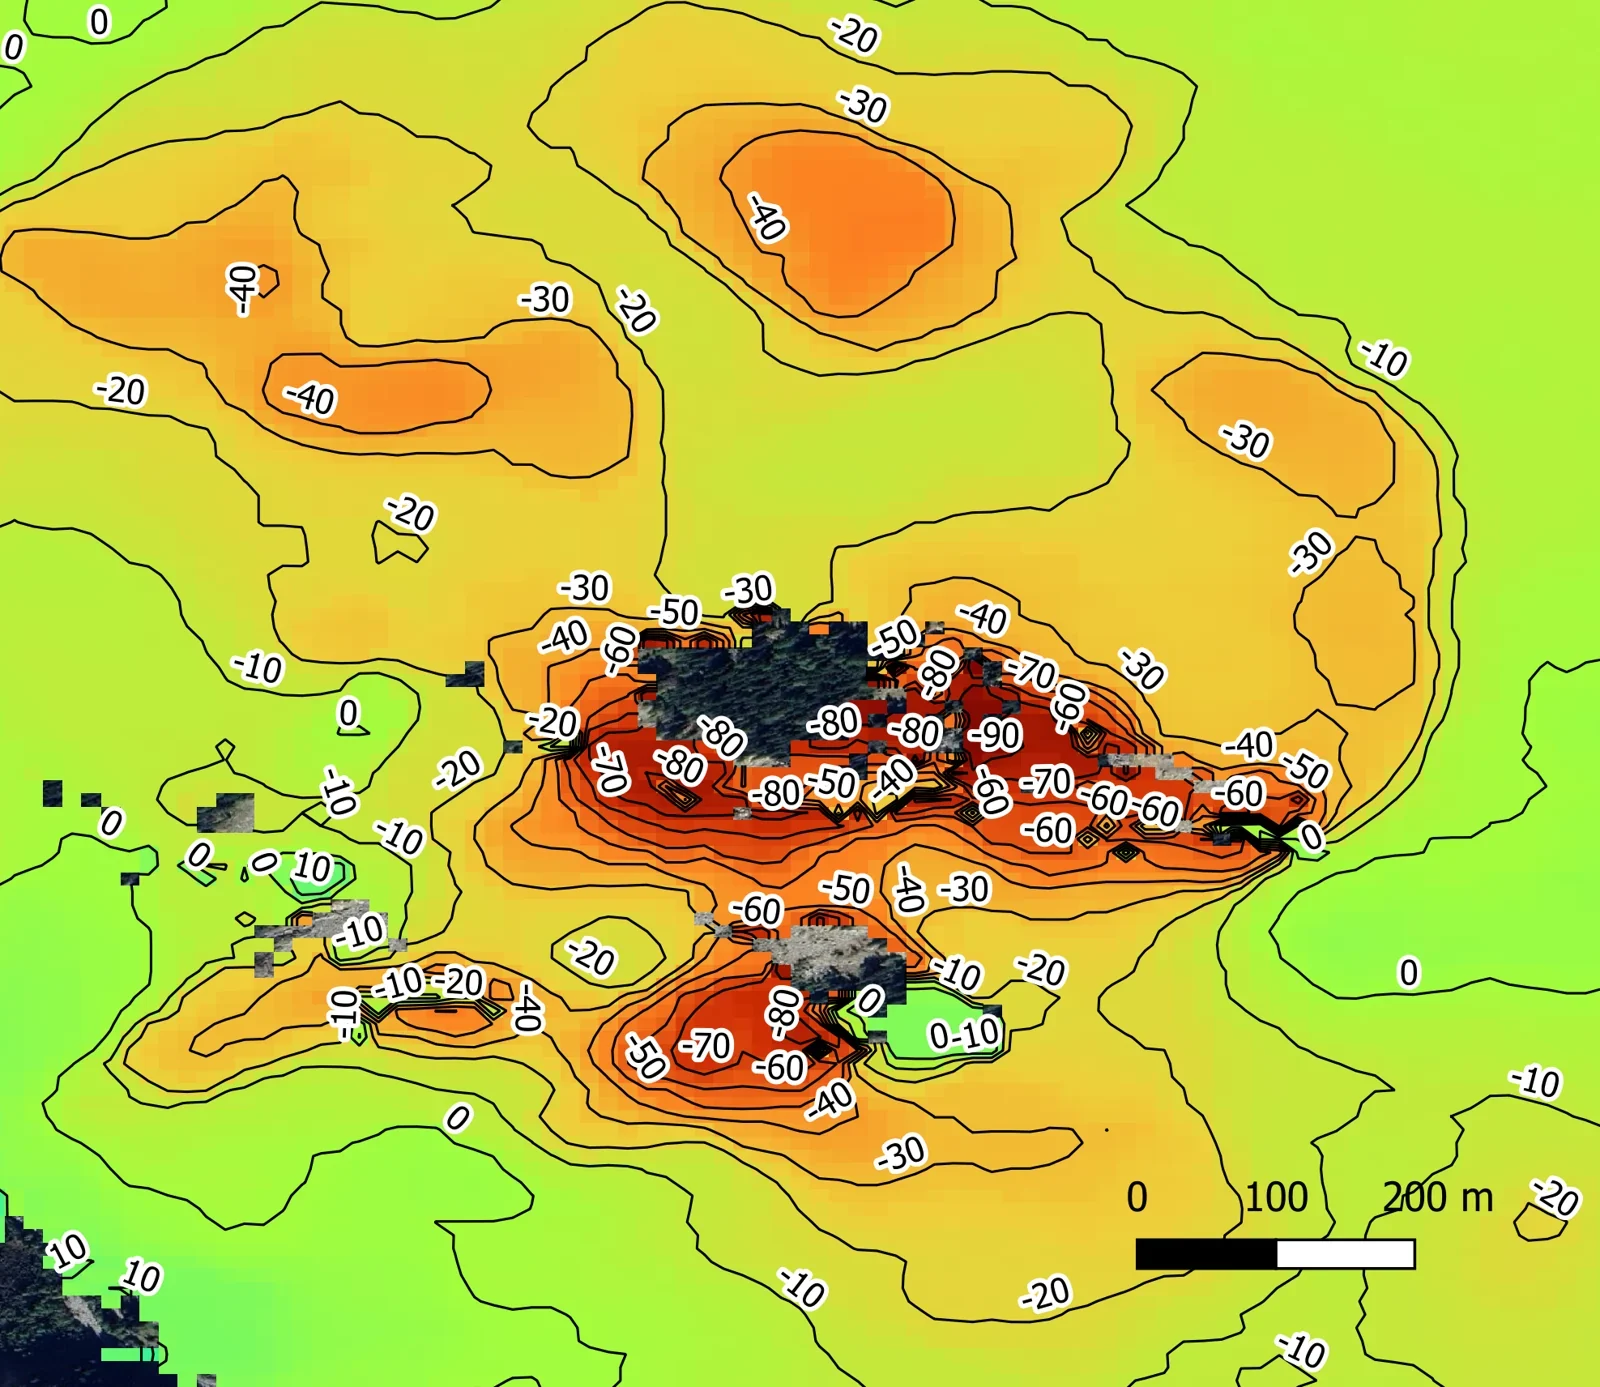
Most active sector: displacement contour lines from L-band InSAR (descending geometry). Product produced from Original SAOCOM Product – ©CONAE – Comisión Nacional de Actividades Espaciales (2021–2026).
Client
Public body
Data period
February 2021 – April 2026
Location
Mountain area, Italy
Technology
L-band satellite SAR interferometry (A-DInSAR), SAOCOM data
Problem
A public body has followed a set of landslides in a mountain environment for years with X-band satellite InSAR: periodic updates that show how each landslide evolves.
In three areas, dense forest and steep slopes left zones without measurement points. That is exactly where information was needed to outline the active sectors and follow their evolution over time.
The question was clear: add satellite data able to measure under vegetation cover, without installing instruments on the slopes.
Why L-band
Each radar satellite works at a different wavelength. The wavelength decides what the signal “sees” and how stable it stays over time, that is, how many measurement points you get.
X-band
about 3 cm
High resolution and many points on buildings, infrastructure and exposed rock. It is the starting dataset of this project (COSMO-SkyMed).
C-band
about 5.6 cm
Regular coverage at regional scale, useful for mapping deformation over wide areas.
L-band
about 24 cm
The signal penetrates vegetation better and stays coherent longer: it returns measurement points even in forested areas.
How we worked
01
Data selection
Three stacks of SAOCOM archive images, 187 in total between 2021 and 2026, distributed in Europe by the Italian Space Agency. For each stack the reference image is chosen to reduce decorrelation.
02
A-DInSAR processing
Multi-temporal analysis of persistent and distributed measurement points: mean velocity along the satellite line of sight and a displacement time series for each point.
03
Post-processing
Interpolated concentration maps, displacement contour lines and, where two orbital geometries were available, decomposition into vertical and East-West components.
04
Interpretation
Reading of the results against the geological and geomorphological setting and the landslide inventory, in one sheet per area.
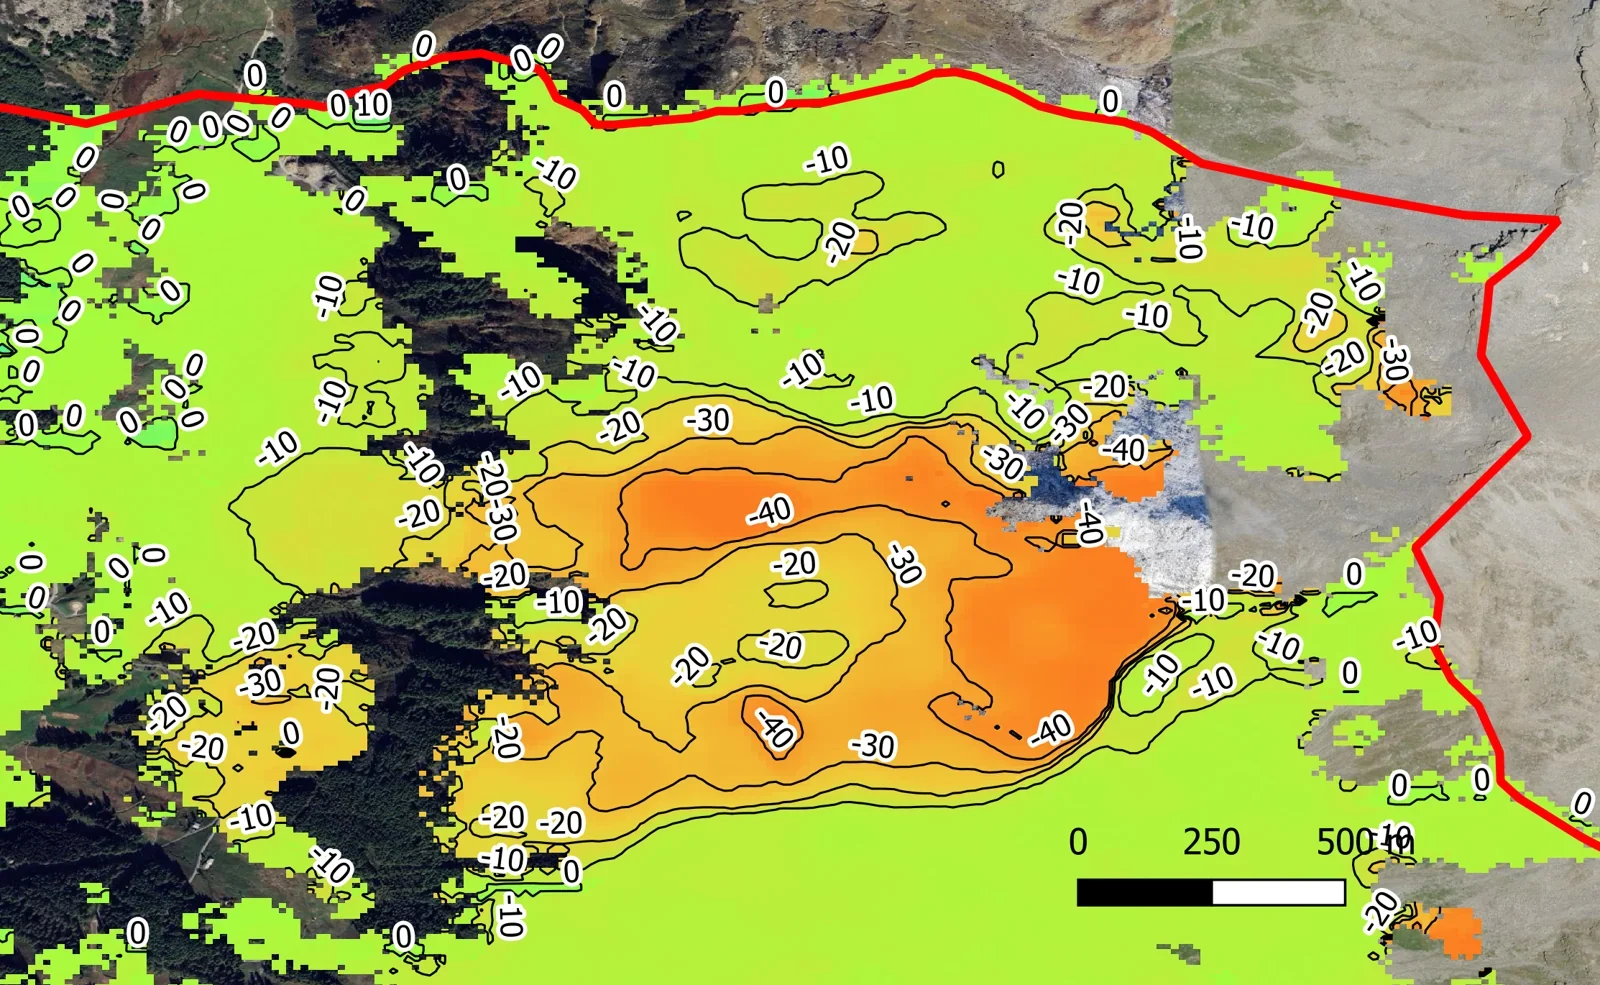
Displacement contour lines on a deforming slope (L-band, descending geometry). Product produced from Original SAOCOM Product – ©CONAE – Comisión Nacional de Actividades Espaciales (2021–2026).
Results
200,000+
measurement points in a single area, even under forest cover
~90 mm/year
line-of-sight velocity in the most active sector
187
SAOCOM images analysed between 2021 and 2026
L-band provided measurement points also in the forested areas not covered by the X-band results. In one area the velocities match those measured in X-band, up to 50 mm/year, with a much higher point density: the zones affected by gravitational deformation are outlined more clearly.
In the largest area the analysis separates three sectors with different behaviour: one moving towards the satellite, up to about 30 mm/year, consistent with horizontal movement along the slope direction; two moving away, up to about 70 and 90 mm/year, with a downward component.
L-band acquisitions are most effective for deformation of a few tens of millimetres per year, including areas with significant vegetation cover.
What the client received
Mean velocity maps
For each area and orbital geometry, along the satellite line of sight.
Vertical and East-West components
Where both geometries were available, to read the real direction of movement.
Displacement contour lines
To see at a glance the extent and gradient of the deforming zones.
Displacement time series
On representative points of each area, to follow accelerations and seasonality.
GIS data and sheets
Shapefiles ready for the client’s GIS and an interpretation sheet for each area.
Frequently asked questions about L-band InSAR
What is L-band InSAR?
It is satellite radar interferometry performed with sensors working at a wavelength of about 24 cm, such as those of the SAOCOM constellation. By comparing images acquired on different dates it measures ground displacement along the satellite line of sight.
Why does L-band work better in vegetated areas?
The longer wavelength passes through canopy and undergrowth better and is less affected by decorrelation. This is why it returns measurement points even on forested slopes, where shorter bands find few.
L-band or X-band for landslide monitoring?
They are used together. X-band has higher resolution and many points on buildings and exposed rock; L-band adds measurements where vegetation is dense. In this project the SAOCOM analysis complemented the COSMO-SkyMed one. Read more about satellite landslide monitoring.
What displacement does satellite InSAR measure?
It measures displacement along the satellite line of sight, also in the past thanks to image archives. With two orbital geometries it derives the vertical and East-West components. It is most effective for deformation from a few millimetres to a few tens of millimetres per year.
Where do SAOCOM images come from?
SAOCOM is the radar constellation of the Argentine space agency (CONAE). In Europe and the Mediterranean the images are distributed by the Italian Space Agency, with a nominal revisit of 16 days.
More slope and landslide case studies

Civitacampomarano
Building deformation on an unstable slope, with satellite InSAR and PhotoMonitoring™.
Read the case

Bonorva
Emergency monitoring of a landslide slope with terrestrial SAR interferometry.
Read the case

Have a slope to monitor?
Tell us about the site: we help you choose the combination of satellite data and ground measurements that fits the phenomenon.